When I enrolled in my honours year at the University of Melbourne in 2020, I did so with the sole intention of running experiments with the Brain, Mind, and Markets Laboratory. I would later end up doing a PhD with the lab, but back then my plans to run experiments were foiled, like many plans in 2020, by the pandemic. Melbourne would eventually become one of the most locked-down cities in the world, which made it somewhat difficult to find participants for experiments.11 Melbourne was in lockdown for a total of 262 days, beating the previous record of 245 days in Buenos Aires, Argentina.
At the time, not being able to run experiments was a huge disappointment. But I ended up having a blast with my first real experience of academic research. I never tried to publish the thesis, but I still think it was a cool project, so I wanted to share the story here. The project also ended up landing me my first 'real job', as a software engineer in public health simulation modelling, so it is both personally and professionally significant to me.
COVID-19
When I am doing something I find difficult, I often procrastinate by taking on other difficult things. This is not a particularly adaptive strategy, but I am happy that it worked out for me during my honours year.
My honours project emerged from another project I was working on at the time, which involved visualising COVID-19 cases in my local area. The government was doing a pretty poor job of this back then. They had built a few clunky Power BI dashboards that were difficult to use and didn't make great use of the data available at the time. At the start of the pandemic, I began scraping these dashboards and eventually programmed my own map-based visualisation using the data.22 The tool is long dead now, but I produced a short animation that explains how it worked.
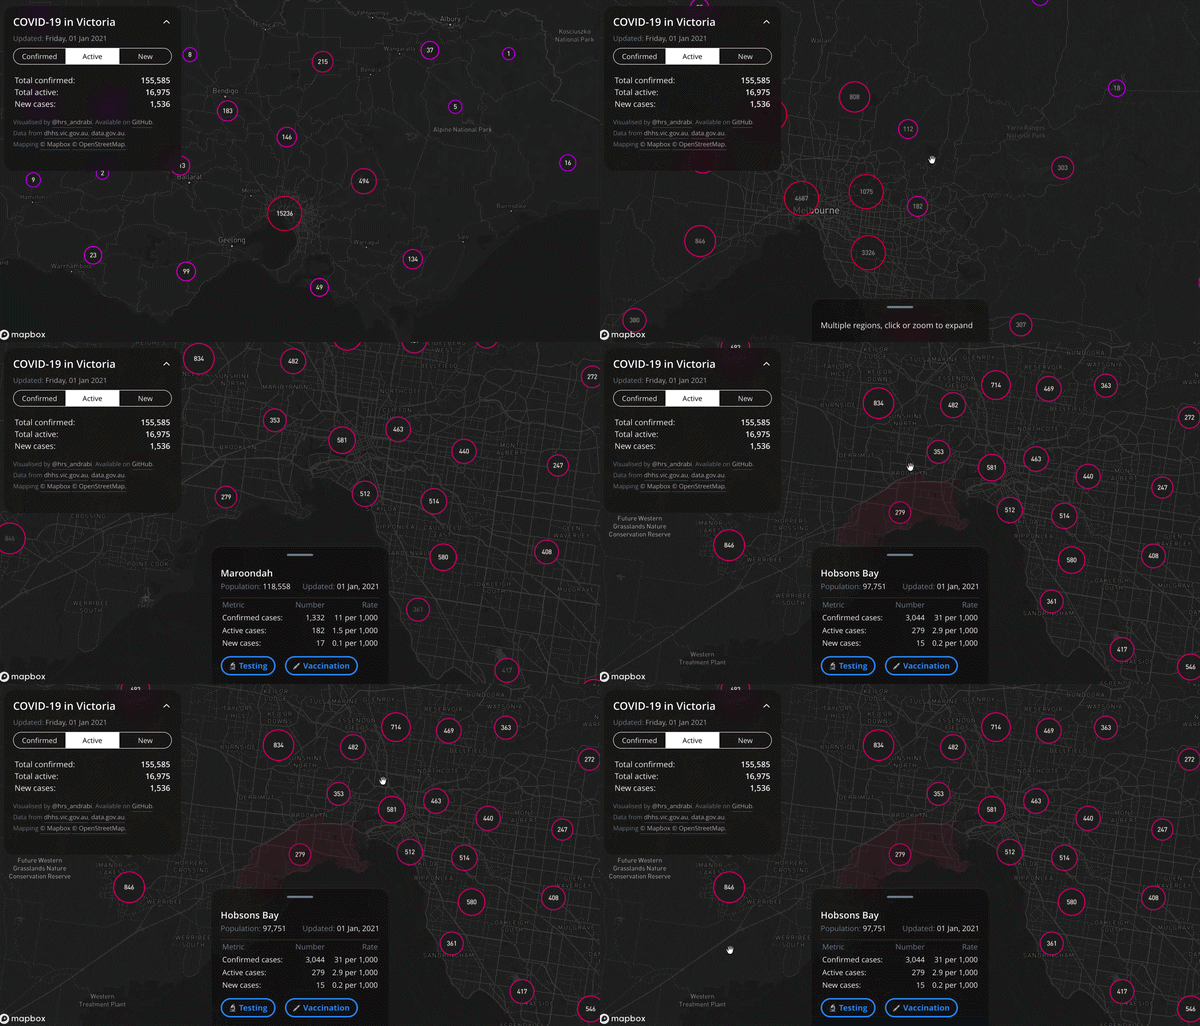
The tool went semi-viral and became more popular than I was prepared for. At its peak, it attracted over 100,000 users a day.
Traffic lights
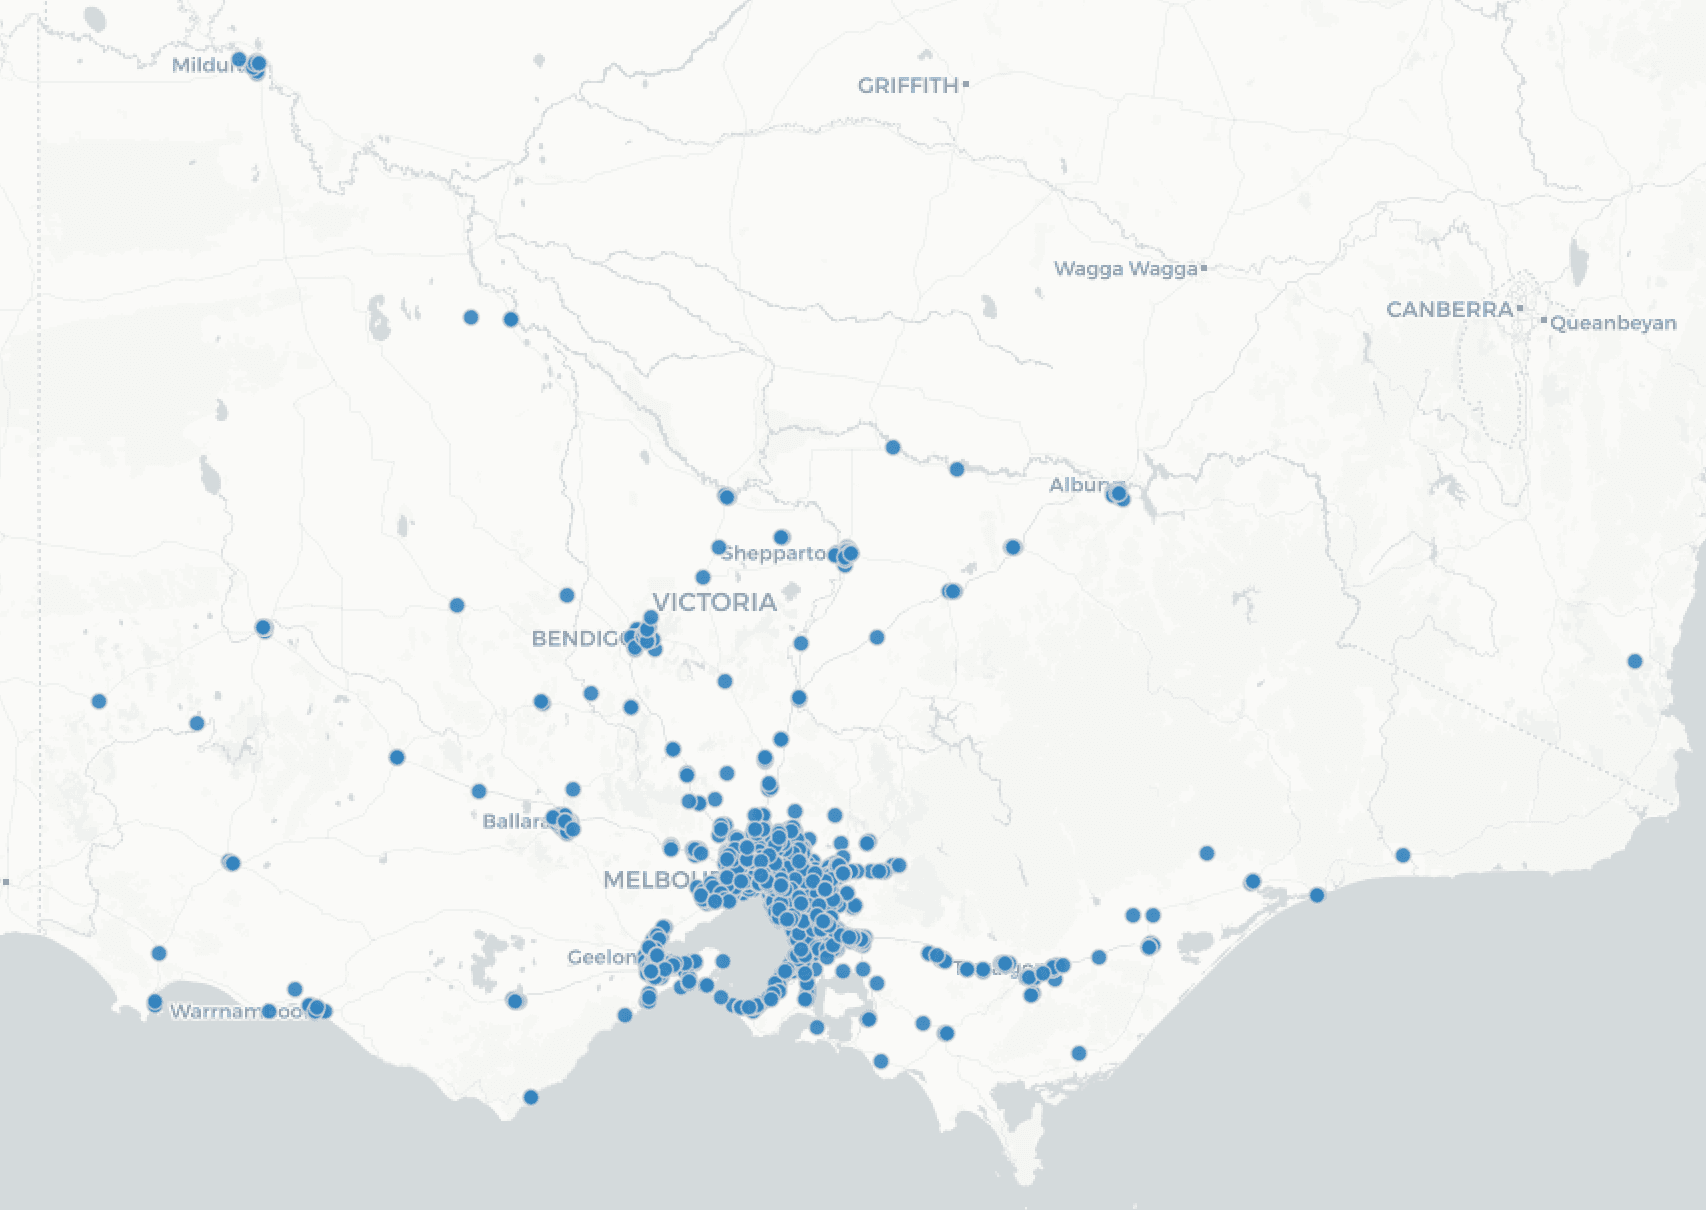
Because I had built this tool, I ended up having access to a somewhat novel dataset of COVID-19 cases in Victoria, Australia, disaggregated by geographic locality. I decided I wanted to use my honours thesis to shoehorn a research project around this dataset.
I managed to do this by combining the COVID-19 data with another really cool, and seemingly underutilised, traffic-signal volume dataset. This dataset tracked traffic patterns from around 5,000 traffic signals throughout Victoria.33 The data captures approximate vehicle counts in 15-minute intervals. Data is sourced from the SCATS system, which involves a loop of wire installed into the road surface that is activated each time a vehicle passes over it. The data is still maintained, and publicly available.
Burdens of lockdown
My pitch for the honours thesis was to use this traffic-signal volume dataset as a proxy for mobility across different localities in Victoria. I then aggregated these mobility patterns based on the socioeconomic characteristics of those localities (income, employment, housing, etc.), with the goal to study the relationship between socioeconomic status and the effectiveness of lockdown restrictions.
The question I wanted to answer was simple: when lockdown policies asked everyone to stay home, did everyone comply equally?
Victoria, and specifically Melbourne, was a fantastic testbed for this question because we experienced an exceptionally severe episode of lockdown policies. The restrictions were implemented in four staggered 'stages' of increasing severity, which provided several opportunities to ask before-and-after, quasi-experimental questions about the effectiveness of lockdown restrictions by socioeconomic status.44 Roughly: Stage 1 and 2 restricted gatherings and closed some non-essential venues; Stage 3 introduced the more familiar "stay at home" rules, where you could only leave for a small number of approved reasons; and Stage 4 was the really intense Melbourne version, with a night-time curfew, tighter business closures, and much stricter limits on movement.
Results
So what did I find? In a nutshell, that lockdown restrictions were broadly effective, but reductions in travel were not equal across socioeconomic status.
The basic pattern was that lockdowns reduced mobility everywhere, but not equally. People in more advantaged areas were more likely to have jobs that could be done remotely, savings that made reduced work more feasible, and living conditions that made staying home easier. People in less advantaged areas were more likely to face the opposite constraints.
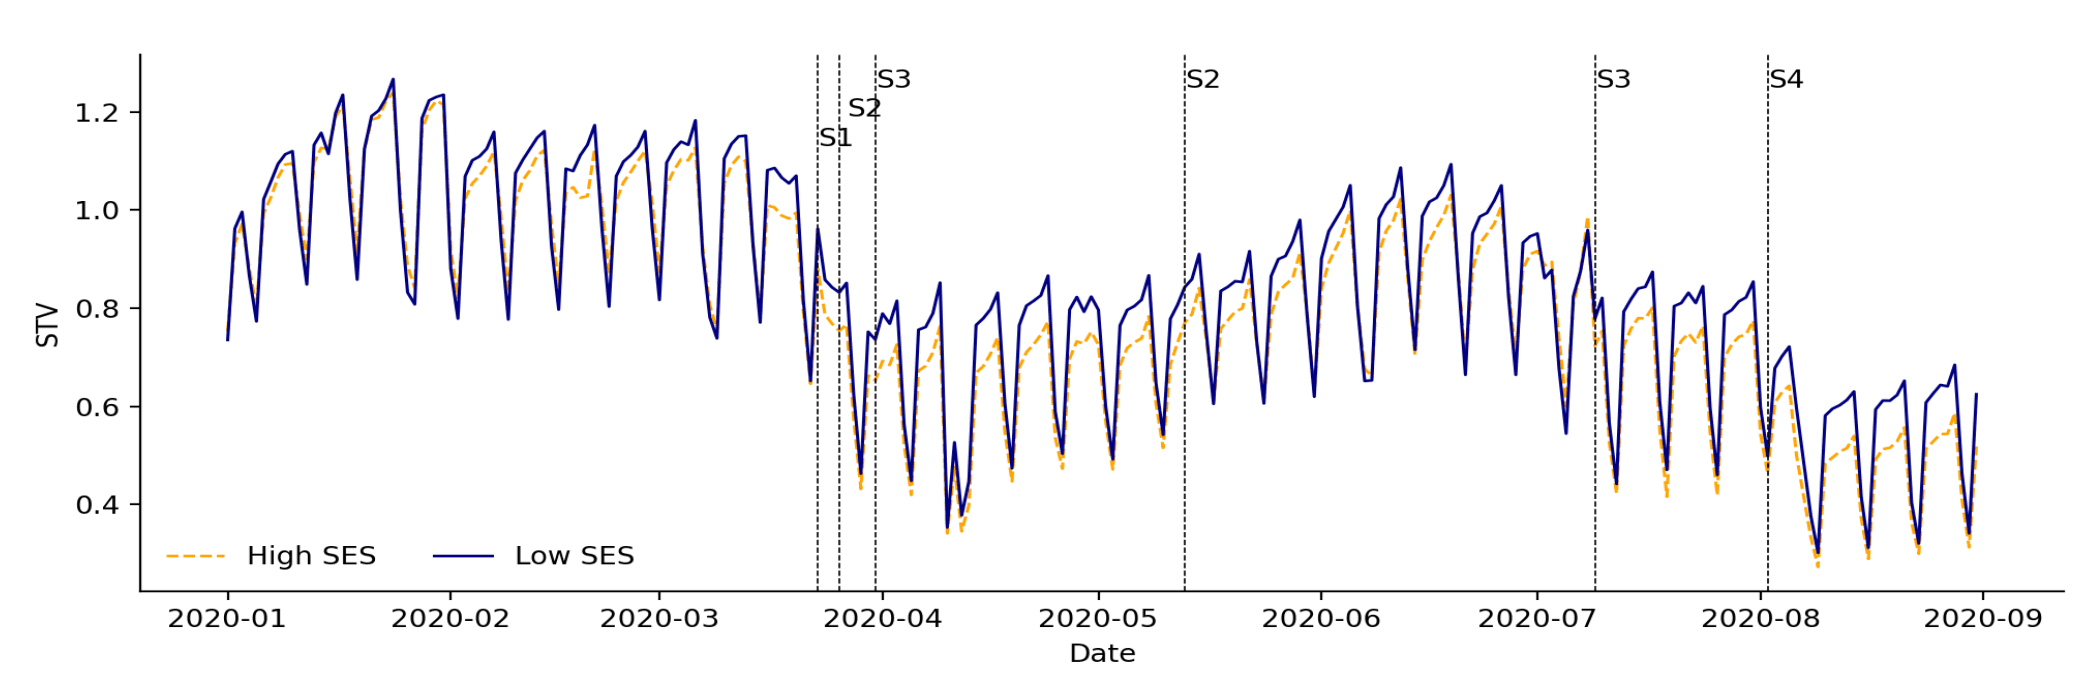
More advantaged areas reduced mobility more sharply, while disadvantaged areas were less responsibe to lockdowns. This pattern was clearest when socioeconomic status was measured through education, occupation, and broader measures of disadvantage. It was less clear when measured purely through economic resources, which suggested that this was not simply about "rich versus poor" in a narrow income sense—it was also about the kinds of jobs people did, the feasibility of working from home, and the living conditions that made it easier or harder to comply with restrictions.
The intra-day traffic patterns were especially revealing. Before lockdown, high- and low-SES areas had fairly similar patterns: the familiar morning peak, a working-day plateau, and an evening peak. During restrictions, those patterns changed. The peaks softened, traffic fell, and the city became quieter. But lower-SES areas still showed more persistent movement throughout the working day.
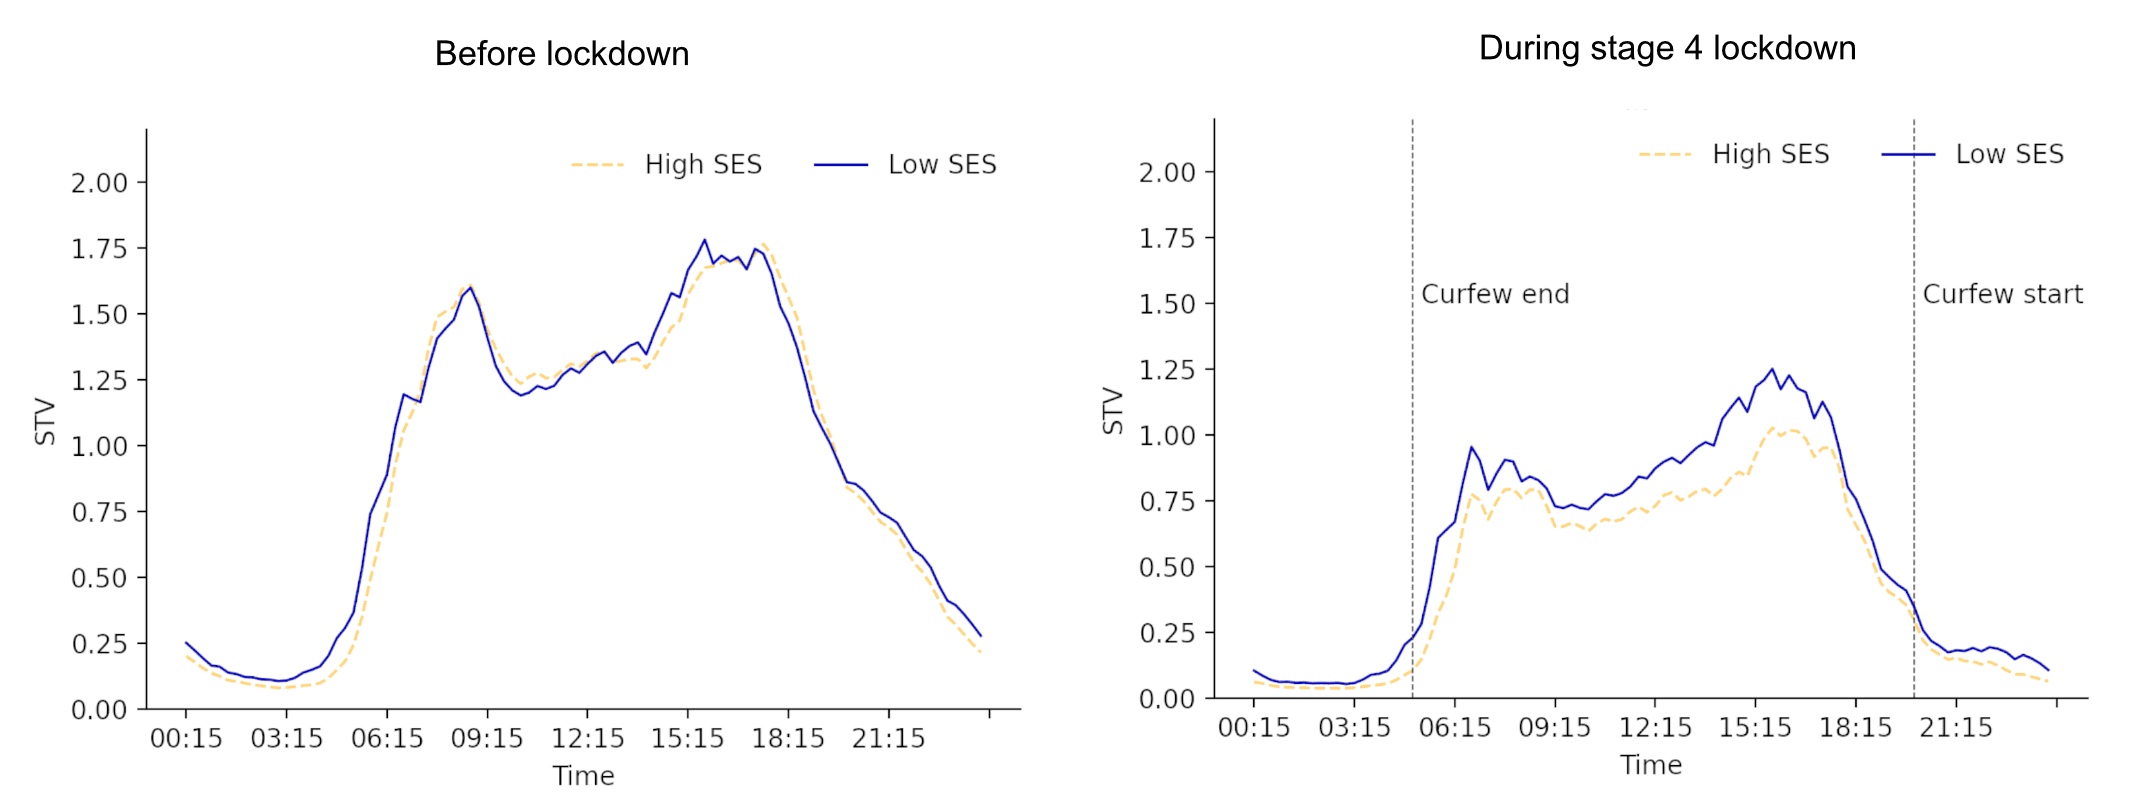
To me, that was the mosst human part of the data. Behind each traffic count was someone who, for whatever reason, still had to be on the road. Not because they were careless, or ignorant, or reckless, but likely because they had to put food on the table.
I also tried to extend this by attempting to answer a harder causal question: could differences in mobility help explain differences in COVID-19 disease burden across socioeconomic groups?
The argument was essentially that mobility patterns, rather than socioeconomic status in and of itself, were a key determinant of disease burden. In other words, socioeconomically disadvantaged areas experienced a higher disease burden because they disproportionately travelled more during lockdown restrictions, not because of some other invisible immunity provided by wealth or privilege. Hence the cheeky (and somewhat cryptic) title of the thesis: COVID-19 Does Not Check Your Wallet Before Infecting You.55 I have my supervisor, Peter Bossaerts, to thank for this title.
The distinction matters because it shifts the interpretation away from blaming communities and toward understanding constraints. If people in some areas kept travelling during lockdown, the explanation is not necessarily that they were less compliant, less informed, or less careful. Many simply did not have an alternative. They may have been doing work that could not be done remotely. They may have faced greater financial pressure. They may have lived in households or worked in industries where "stay home" was a much easier instruction to follow in theory than in practice.
Admittedly, in hindsight I did not do a statistically convincing enough job of making this 'mobility-is-an-omitted-variable' causality argument. That was partly because of the empirical approach I used, and partly because of limitations in the data available at the time. These issues made some of the results quite sensitive to modelling choices, so they should definitely be taken with a grain of salt.
Still, I think there is an important story here. Lockdown was often described as a uniform policy: the same rules, the same burdens. But uniform rules do not create uniform burdens. A restriction can be legally identical across a city while being practically very different depending on whether your job, income, household, and neighbourhood allow you to comply.
Viruses do not discriminate, but they often reveal inequalities that already exist.
If you are interested in reading the full thesis, you can find it here.
Footnotes
-
Melbourne was in lockdown for a total of 262 days, beating the previous record of 245 days in Buenos Aires, Argentina. ↩
-
The tool is long dead now, but I produced a short animation that explains how it worked. ↩
-
The data captures approximate vehicle counts in 15-minute intervals. Data is sourced from the SCATS system, which involves a loop of wire installed into the road surface that is activated each time a vehicle passes over it. The data is still maintained, and publicly available. ↩
-
Roughly: Stage 1 and 2 restricted gatherings and closed some non-essential venues; Stage 3 introduced the more familiar "stay at home" rules, where you could only leave for a small number of approved reasons; and Stage 4 was the really intense Melbourne version, with a night-time curfew, tighter business closures, and much stricter limits on movement. ↩
-
I have my supervisor, Peter Bossaerts, to thank for this title. ↩